
Welcome to the Bricksmart blog
Why we're writing, what we're writing about, and the one promise we're making on every post. Every statistic links to its source.
Sayu
Category
What the HMLR + MHCLG + ONS data actually says about UK house prices, rents and transaction volume.
Why we're writing, what we're writing about, and the one promise we're making on every post. Every statistic links to its source.
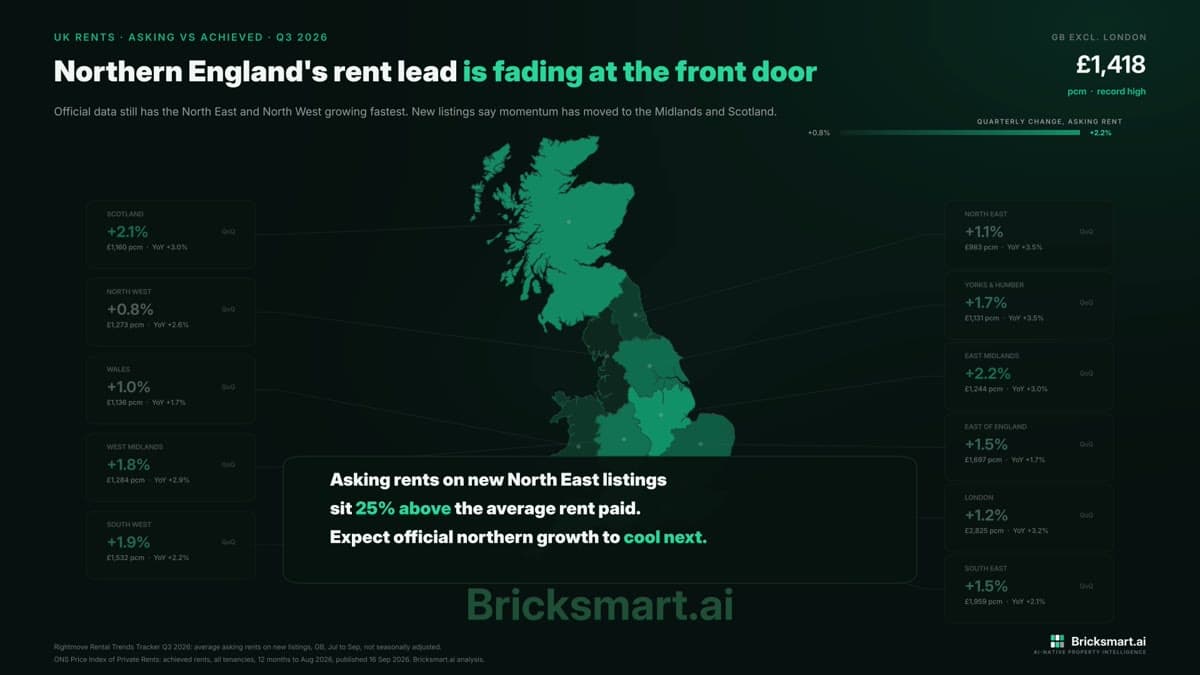
Official figures still have the North East and North West growing fastest. New listings say the momentum has moved to the Midlands and Scotland.
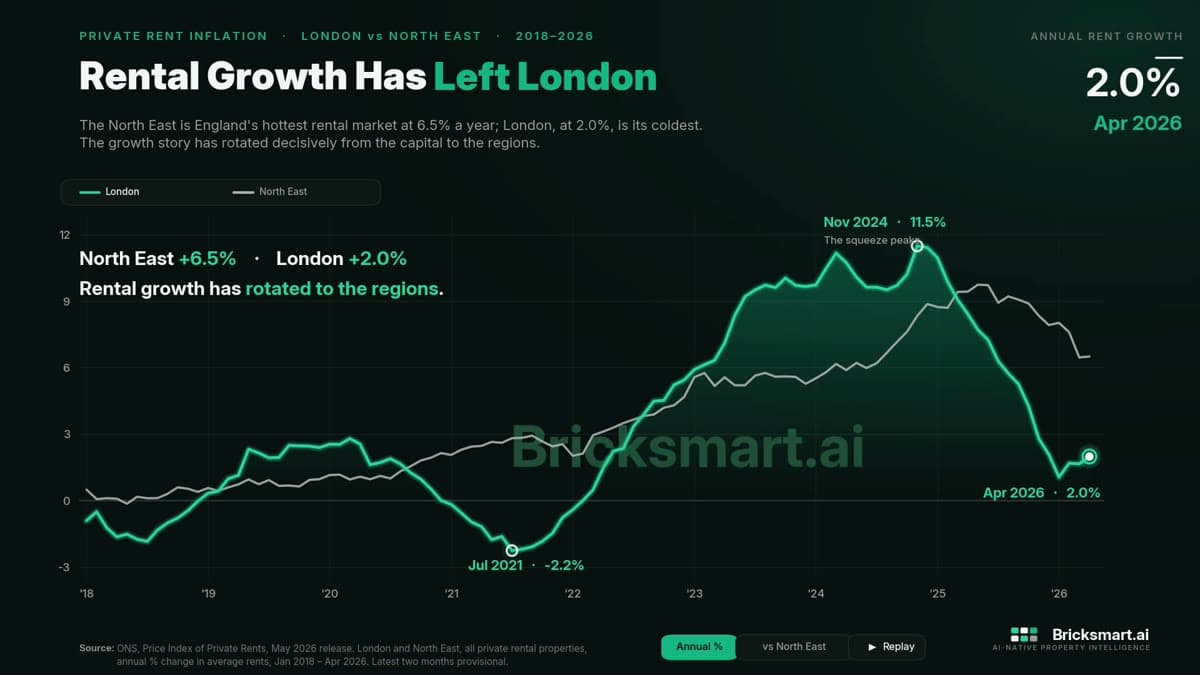
The North East is now England's fastest-growing rental market at 6.5% a year, and London is the slowest at 2.0%. Eight years of official data show how the growth story moved from the capital to the regions.
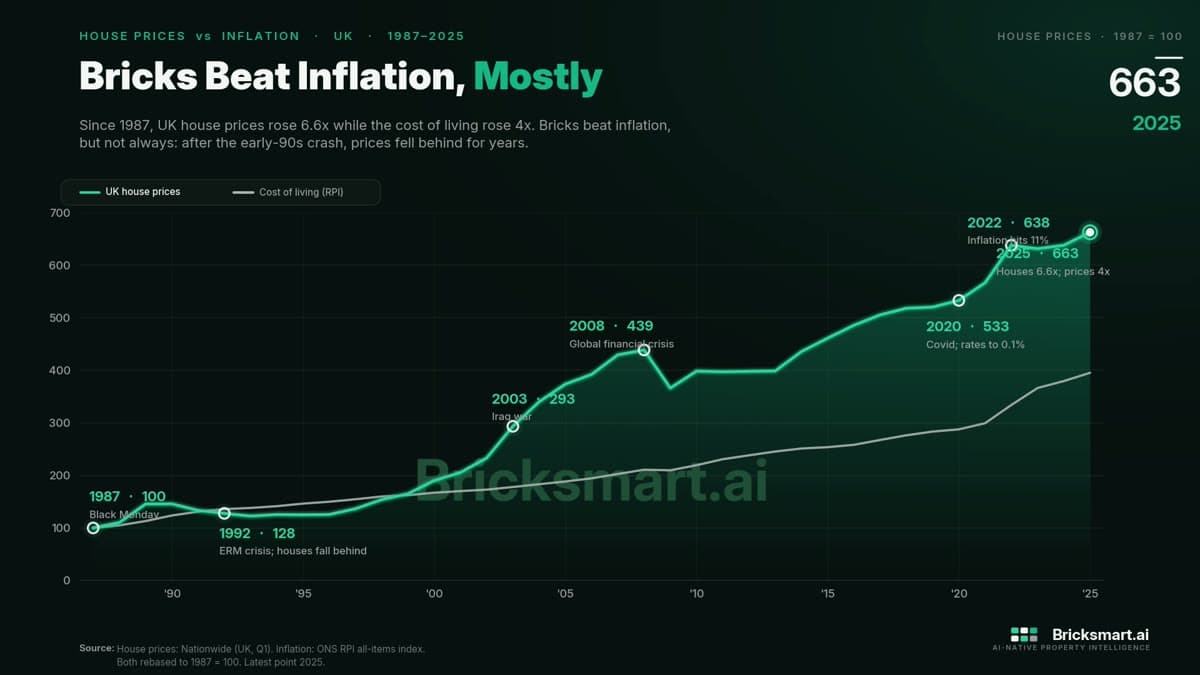
Since 1987 UK house prices have risen 6.6 times while the cost of living rose 4 times. But not always. After the early-90s crash, prices fell behind inflation for years.