
Bricks beat inflation, mostly
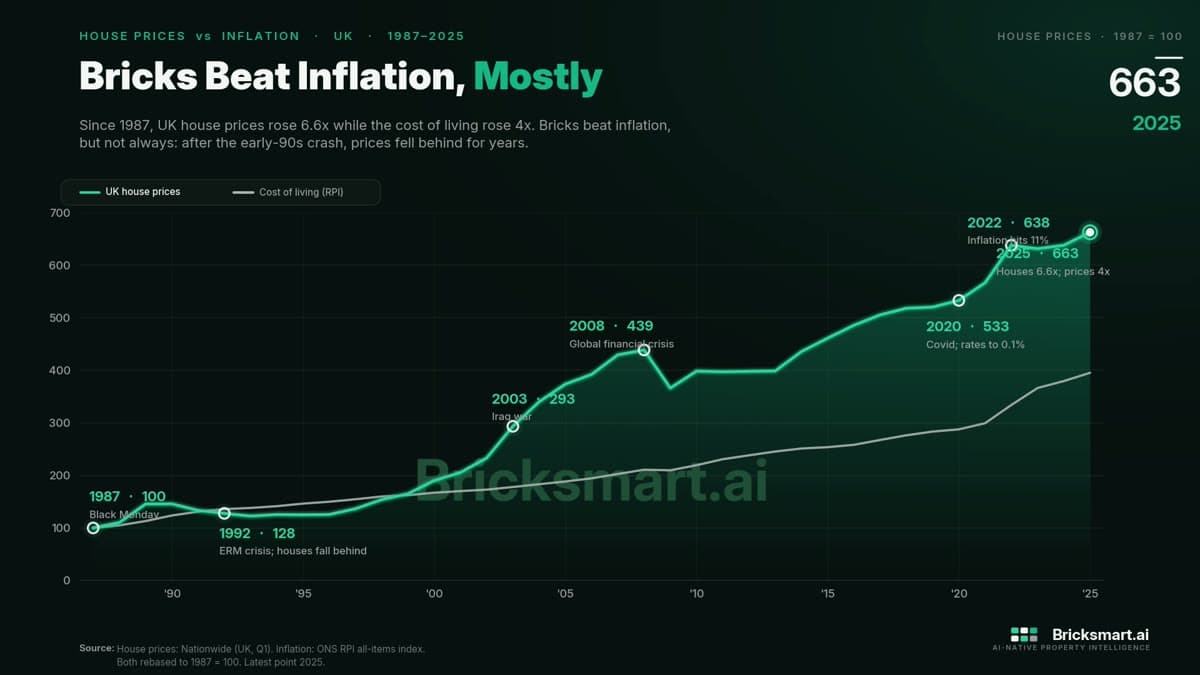
Since 1987 UK house prices have risen 6.6 times while the cost of living rose 4 times. But not always. After the early-90s crash, prices fell behind inflation for years.
Sayu
Tag
Since 1987 UK house prices have risen 6.6 times while the cost of living rose 4 times. But not always. After the early-90s crash, prices fell behind inflation for years.